Monday, June 17, 2013

Future Bakken Output and the Average Well Profile

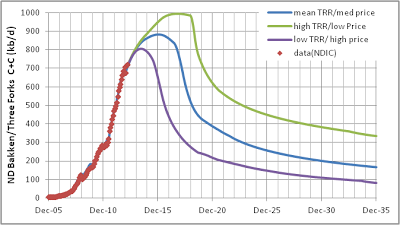
In my June 14 post I discussed future decreases in average well productivity based on a single average well profile to create scenarios which would match the range of technically recoverable resources (TRR) in a recent USGS estimate for the Bakken/ Three Forks.

A recent discussion at the June 15, 2013 Drumbeat at the Oil Drum was very interesting with Rune Likvern providing  great insight (as usual) into recent data on Bakken output in North Dakota.

Mr Likvern believes that we may be seeing a decrease in average well productivity because a simulation with wells added at a rate of 125 well per month from Jan 2013 to April 2013 is showing greater output than recent data with 70 fewer wells added (500 for simulation vs 570 actual).  A decrease in average well productivity is one possible explanation.  An alternative possibility is that the average well profile may be different from the average well profile that Mr. Likvern has chosen.

I have created various well profiles in an attempt to match James Mason's work, Rune Likvern's work, the NDIC typical well, and the actual production data from the NDIC.  I have recently created some newer well profiles by using a minimization of the sum of the squared residuals between the model and data over the period from Jan 2010 to April 2013.  When no constraints are put on the minimization we get qi=11070, b=0.41, and d=0.078 (I call this model 7).

Friday, June 14, 2013

Future Bakken Crude Oil Output, Oil Price, USGS Estimates, and Decreases in Well Productivity

Summary Chart ND Bakken/Three Forks Scenarios

There is quite a bit of optimism in the US about potential future crude oil output.  Due to the media reports that the US will become self sufficient in oil output, many Americans believe that oil prices are likely to decline in the future due to the abundance of oil resources.  This view may be too optimistic.

The enthusiasm is based on the success in the North Dakota portion of the Bakken/Three Forks play since 2008. The high oil prices over most of the period from 2008 to 2012 has made the high cost oil from North Dakota profitable. Bakken/Three Forks output in North Dakota has expanded from 43 kb/d in Mar 2008 to 719 kb/d in Mar 2013, a 16 fold increase over 5 years. The media believes these increases will continue, but the rate of increase is slowing considerably.

As a cautionary tale, consider Bakken/ Three Forks crude output in Montana (at link click on formation code in left most drop down box and type "bak" in search box, most output is from the Elm Coulee fields (all charts can be clicked to enlarge):

Tuesday, May 21, 2013

Real Oil Prices and the Effect on Future ND Bakken Output

I often read The Oil Drum blog and pointed readers of the Drum Beat to my most recent post here.  Rune Likvern asked a question about how future oil prices will effect my scenarios.  This is an excellent question because it is often claimed that the recent surge in US oil output may lead to lower oil prices.  I expect there is a little too much optimism about future output from the Bakken/Three Forks and Eagle Ford plays, but let's consider two scenarios proposed by Mr. Likvern.

Scenario 1 considers a slower rise in real oil prices than I proposed in my previous post, real oil prices rise to $120/barrel (Jan 2013$) by Jan 2018.


Figure 1
Figure 1 requires some explanation.  Break even oil prices rise to the real market oil price by Sept 2016 at $115 per barrel and the wells added ramp down to zero by Dec 2017.  It is assumed that real oil prices continue to rise at 3.29 % per year and that the decrease in well productivity slows to zero as no new wells are drilled.  Eventually the real oil price rises above the break even price and it is assumed that when the real oil price is 110 % or more of the break even oil price that new wells are added and well productivity then continues to decrease.  This cycle repeats 3 times between 2018 and 2037 and explains the bumps in output in 2021-2, 2027-8, and 2033-4.

Thursday, May 16, 2013

Updated Well Profile for the North Dakota Bakken and the Effect on future scenarios


Note that all of the "Bakken" Scenarios I have presented, in this post and previous posts only cover the North Dakota portion of the Bakken/Three Forks play.

A recent post by Rune Likvern at the Oil Drum entitled, Is the Typical NDIC Bakken Tight Oil Well a Sales Pitch? has provided some new information which I will use to update my recent scenario for future Bakken output.

Another post by Mr. Likvern from which I gathered considerable knowledge is entitled Is Shale Oil Production from Bakken Headed for a Run with “The Red Queen”? . In addition a post by Heading Out at the Oil Drum had a number of helpful comments by both Mr Likvern and Webhubbletelescope, the entire thread has comments of interest. There are also a number of posts on the Bakken at The Oil conunDRUM  blog(written by Webhubbletelescope) from which I have learned much. I am indebted to both Webhubbletelescope and Mr Likvern for sharing their knowledge.

Friday, April 26, 2013

Bakken Model Suggests 7 Billion barrels total, enough for 1.3 years of US Crude inputs


Note that all images can be enlarged with a mouse click.
 
Above is one possible scenario for future output from the Bakken which suggests a total cumulative output of 7 billion barrels (Gb) from 1953 to 2073.  Current US crude oil inputs to refineries is about 15 million barrels per day  (52 week average above 14.9 MMb/d for past 6 months) which is 5.475 Gb per year, the total Bakken output of 7 Gb would supply current refinery inputs for 1.27 years.  When we account for the 0.57 Gb of Bakken which has been produced we are left with about 1.2 years of crude inputs at current levels.
 
The above estimate is based on  a presentation from the North Dakota Industrial Commission (NDIC) Oil and Gas Division (see slides 25 to 30).  This presentation suggests about 41,000 wells will be drilled in the Bakken at a rate of 1500-3000 wells per year, I chose 2460 wells per year and a total of 42,000 wells drilled by Sept 2028.
 

Saturday, December 15, 2012

Quick update to tight oil models

I have extended both the Bakken and Eagle Ford Shale models out to 2040.  I have assumed no other significant tight oil plays are developed in the US besides these two, this is a somewhat pessimistic assumption, though most other assumptions are relatively optimistic.  These may balance out in the long run.

As the Bakken becomes fully drilled up at about 40,000 wells (around the end of 2024) it is assumed that drilling rigs are moved to Texas from North Dakota to work the Eagle Ford play and that there is a ramp up in the number of wells drilled there per month as a result.

In this current scenario, the tight oil output comes close to matching the EIA 2013 outlook (red diamonds in figure below) from 2018 to 2028, but the output is lower both before and after that period.

Bakken:


Eagle Ford:


US Tight Oil:


DC

DC


Sunday, December 2, 2012

Update on Bakken Model using hyperbolic decline

The recent World Energy Outlook (WEO) published by the International Energy Agency (IEA) predicts that US unconventional output will rise to 5 million barrels per day (Mb/d) in 2020.  This increased crude plus condensate (C+C) output will primarily come from tight oil in the Bakken trend in North Dakota and the Eagle Ford trend in Texas.

I decided to update my model of the Bakken based on information learned while attempting to model the Eagle Ford trend in Texas.  One thing I discovered in my modelling of the Eagle Ford was that the hyperbolic decline model seems to give a better approximation of the Eagle Ford then the Dispersive Discovery Model that I used in my previous Bakken Model.  For this reason I used a hyperbolic decline model for my updated Bakken Model.


The early wells from 2004 to 2007 have a lower well profile with cumulative output about half that of wells starting production between 2008 and 2012.  My previous model had decreases in well productivity of 1 % each month from 2013 to 2019 with new wells starting production in Dec 2019 producing 45 % less cumulative oil than those beginning production in Dec 2012. 

I decided that this was too large a decrease in well productivity to be realistic.  For the updated model, wells starting production in Feb 2013 produce a cumulative output about 0.5 % less than those which started producing the previous month.  Each year the well productivity profile decreases by about 6 % compared to new wells from 1 year earlier.  By Dec 2019 new well productivity has decreased by 66 % compared to new wells from Jan 2013.  The chart above only shows 3 cumulative output curves with one curve (Jun-16) between the Jan 2008 to Dec 2012 cumulative and the
Dec-2019 cumulative curves.  In fact there are 94 curves between the Jan-13 cumulative curve and the Dec-19 cumulative curve one for each month.


The data for C+C output in barrels per day and number of producing wells can be found here. 

In order to forecast future output we assume the average well profile remains unchanged for new wells from Jan 2008 until Jan 2013 and then declines for each month from Feb 2013 to Dec 2019 by 0.5 % as discussed above. 

To estimate the number of producing wells in Oct 2012 we use the average of the change in the number of producing wells (delta # of wells) for the previous 7 months which is 162.  This number is added to the 4629 wells producing in Sept 2012, thereafter the delta # of wells producing is assumed to increase by 3 each month up to Dec 2013 (162, 165, .... , 201, 204) to a total of 7374 producing wells. Note that between Jan 2010 and Sept 2012 the trend in the increase in delta # of wells was 4 per month. So the increase in the delta # of wells producing of 3 represents a decrease from the previous trend. 

This rate of increase of delta # of wells is decreased further to 2 each month from Jan 2014 to Dec 2015 to reach a total # of producing wells of 12870.  The rate of increase of the delta # of wells producing decreases again to 1 per month from Jan 2016 to Dec 2017 and producing wells increase to 19218.  From Jan 2018 to Dec 2019 the delta # of wells producing stays steady at 276 with the total number of wells reaching 25842.  

The model by James Mason suggests 40000 wells would be the saturation point for the Bakken with little room for any further increase in producing wells.  In the chart below notice the rapid dropoff in output after Dec 2019 when new wells are no longer added.  If wells continue to be added at 276 new wells per month then 40000 wells are reached in April 2024, at that point (if Mason's model and my model are both correct) we would see a rapid drop in oil production.


Output peaks at 1.35 Mb/d in early 2019 and then remains on plateau until Dec 2019, this is an example of Rune Likvern's "Red Queen" effect.

I hope to publish a post on the Eagle Ford soon.  For some flavor of this, consider this chart:


The Texas RRC database was used to develop the average well profile.  Note that data is estimated from a combination of Texas RRC data and EIA data.  The Texas data was used to estimate the  percentage of all Texas oil coming from the Eagle Ford trend, then this percentage was multiplied by EIA Texas output to estimate Eagle Ford oil output.

Based on these models I think the upper limit to tight oil output from the Bakken and Eagle Ford in 2020 is about 2.7 Mb/d rather than the 5 Mb/d predicted by the IEA.  Note that these estimates are quite optimistic and should be thought of as an upper bound to what may be attainable. This is an increase of about 1.6 Mb/d over current US tight oil output of about 1.14 Mb/d.  A more realistic scenario might be a doubling of output to 2.3 Mb/d in 2020.


DC