Wednesday, October 23, 2013

Exploring Future Bakken Decrease in Estimated Ultimate Recovery (EUR)


Fig 1
In this post I will explore a number of different scenarios for future North Dakota Bakken crude oil production using an updated interactive spreadsheet which can be downloaded here.  More details can be found later in the post (scroll down to fig 12 and read the paragraph above that figure).  The new spreadsheet allows the user to change when the decrease in new well EUR begins and the length of time from the start of the decrease in EUR to the maximum monthly rate of decrease.  The earlier spreadsheet presented in my previous post had these two parameters fixed at 6 months after June 2013 for the start of the EUR decrease and 18 months for the length of time for the rate of EUR decrease to reach its maximum.

Wednesday, October 16, 2013

Cool Tools for considering Future Bakken Output


Webster Hubble Telescope (WHT) has a new blog called Context Earth with a cloud hosted server with some of his oil reserve models. See the Red Queen tight oil model 2.  This inspired me to create an interactive spreadsheet which does something similar. 

The spreadsheet is called bakken2.xlsx and can be found here on Google Drive.

One difference between WHT’s “red queen tight oil model 2” and my bakken2 model is that the EUR of new wells is about 280 kb in his model and 340 kb for my model at 30 years. 

A second difference is that my model allows the new well EUR to decrease at any annual rate from -0.1 to .99 (10 % increase to a 99 % decrease) starting in Jan 2014 and rising to the maximum monthly rate by June 2015.

Wednesday, September 25, 2013

Update to North Dakota Bakken / Three Forks Scenarios


The link above is to a Rigzone article discussing the April 2013 USGS Bakken/Three Forks estimate, which was referenced by Robert Rapier at


The USGS slide presentation can be found at


and click on the slide presentation pdf link near the bottom of that page.

 Near the end of that slide presentation it breaks out the 7.4 BBO for all of the US Bakken/Three Forks into Montana and North Dakota sections of the play.  North Dakota has a mean estimate of 5.8 BBO of undiscovered technologically recoverable resources (TRR) in the Bakken/ Three Forks.

I had been ignoring the "undiscovered" and was incorrectly interpreting the estimate as the full TRR, until I read the following in the Rigzone article:

Thursday, August 29, 2013

Eagle Ford Shale may soon reach 1 million barrels per day(C+C)

I have made a number of comments about the Eagle Ford Shale (EFS) and possible underreporting by the Texas Railroad Commission (TRRC) of crude plus condensate (C+C) output. See my comments at peak oil.com (fourth comment by dcoyne78 on that page) and at peakoilbarrel.com  (see my response to Mike's comment in the comments section.)

The first point is that the TRRC data for Texas(TX) statewide C+C is quite different from the data reported by the US Energy Information Administration (EIA) for TX C+C.

Which data should we believe? 
Edit (Jan 16, 2014) see new chart at bottom of post.

Monday, June 17, 2013

Future Bakken Output and the Average Well Profile

In my June 14 post I discussed future decreases in average well productivity based on a single average well profile to create scenarios which would match the range of technically recoverable resources (TRR) in a recent USGS estimate for the Bakken/ Three Forks.

A recent discussion at the June 15, 2013 Drumbeat at the Oil Drum was very interesting with Rune Likvern providing  great insight (as usual) into recent data on Bakken output in North Dakota.

Mr Likvern believes that we may be seeing a decrease in average well productivity because a simulation with wells added at a rate of 125 well per month from Jan 2013 to April 2013 is showing greater output than recent data with 70 fewer wells added (500 for simulation vs 570 actual).  A decrease in average well productivity is one possible explanation.  An alternative possibility is that the average well profile may be different from the average well profile that Mr. Likvern has chosen.

I have created various well profiles in an attempt to match James Mason's work, Rune Likvern's work, the NDIC typical well, and the actual production data from the NDIC.  I have recently created some newer well profiles by using a minimization of the sum of the squared residuals between the model and data over the period from Jan 2010 to April 2013.  When no constraints are put on the minimization we get qi=11070, b=0.41, and d=0.078 (I call this model 7).

Friday, June 14, 2013

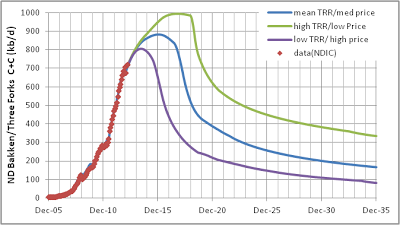
Future Bakken Crude Oil Output, Oil Price, USGS Estimates, and Decreases in Well Productivity

Summary Chart ND Bakken/Three Forks Scenarios

There is quite a bit of optimism in the US about potential future crude oil output.  Due to the media reports that the US will become self sufficient in oil output, many Americans believe that oil prices are likely to decline in the future due to the abundance of oil resources.  This view may be too optimistic.

The enthusiasm is based on the success in the North Dakota portion of the Bakken/Three Forks play since 2008. The high oil prices over most of the period from 2008 to 2012 has made the high cost oil from North Dakota profitable. Bakken/Three Forks output in North Dakota has expanded from 43 kb/d in Mar 2008 to 719 kb/d in Mar 2013, a 16 fold increase over 5 years. The media believes these increases will continue, but the rate of increase is slowing considerably.

As a cautionary tale, consider Bakken/ Three Forks crude output in Montana (at link click on formation code in left most drop down box and type "bak" in search box, most output is from the Elm Coulee fields (all charts can be clicked to enlarge):

Tuesday, May 21, 2013

Real Oil Prices and the Effect on Future ND Bakken Output

I often read The Oil Drum blog and pointed readers of the Drum Beat to my most recent post here.  Rune Likvern asked a question about how future oil prices will effect my scenarios.  This is an excellent question because it is often claimed that the recent surge in US oil output may lead to lower oil prices.  I expect there is a little too much optimism about future output from the Bakken/Three Forks and Eagle Ford plays, but let's consider two scenarios proposed by Mr. Likvern.

Scenario 1 considers a slower rise in real oil prices than I proposed in my previous post, real oil prices rise to $120/barrel (Jan 2013$) by Jan 2018.


Figure 1
Figure 1 requires some explanation.  Break even oil prices rise to the real market oil price by Sept 2016 at $115 per barrel and the wells added ramp down to zero by Dec 2017.  It is assumed that real oil prices continue to rise at 3.29 % per year and that the decrease in well productivity slows to zero as no new wells are drilled.  Eventually the real oil price rises above the break even price and it is assumed that when the real oil price is 110 % or more of the break even oil price that new wells are added and well productivity then continues to decrease.  This cycle repeats 3 times between 2018 and 2037 and explains the bumps in output in 2021-2, 2027-8, and 2033-4.