 |
| Fig 1 TRR 6 to 11.3 Gb |
A recent post at Peak Oil Barrel by Jean Laherrere suggested an ultimate recoverable resource(URR) for the North Dakota Bakken/Three Forks of about 2.5 Gb based on Hubbert Linearization. This conflicts with a recent (April 2013) USGS mean (F50) estimate of 8.4 Gb. I decided to update my scenarios based on the range of USGS estimates from F95=6 Gb to F5=11.3 Gb for the North Dakota(ND) Bakken/ Three Forks. Note that at year end 2011 there were 2.6 Gb of crude proven reserves in ND and at the end of 2007 about 0.5 Gb, I will assume all of this reserve increase came from the Bakken/ Three Forks, so 2.1 Gb of proven reserves added to 0.35 Gb of oil produced from the Bakken/ Three Forks gives us 2.45 Gb for a minimum URR. The Hubbert Linearization points to about 0.05 Gb of undiscovered oil whereas the USGS suggests 3.5 to 8.9 Gb of undiscovered technically recoverable resource(TRR) in the North Dakota Bakken/Three Forks.
Note that Mr. Laherrere has forgotten more about geology than I know. He may have information that I don't have access to or has read the USGS April 2013 Bakken/Three Forks assessment and found that the report was not credible. I have assumed in my analysis that the USGS analysis is correct, if it is not then my analysis will also be flawed. I would love to hear from Mr. Laherrere about the specific problems he sees with the USGS analysis, I no doubt would learn much.
In Figure 1 three scenarios are presented which represent the F95, F50, and F5 cases from the USGS analysis. F95 means there is a 95% probability that the TRR will be higher than 6 Gb and likewise for F50=8.4 Gb and F5=11.3 Gb. It is assumed in all three scenarios that 175 wells per month are added from Dec 2013 to Jan 2032, about 45,000 wells total. All oil fields have sweet spots, which are limited in area. When these more productive areas run out of space for more wells, then less productive areas must be chosen for drilling and the estimated ultimate recovery(EUR) of the average new well will decrease.
The average new well EUR decrease can be thought of as a shift in the cumulative output curve. In the chart below, the average new well from Jan 2015 is compared against an average new well from Jan 2018. So far there is no evidence that such a decrease in new well EUR has begun, the average well through 2012 looks very much like the new wells from 2008, in my medium scenario I assume the average new well EUR remains at this 2008 to 2012 level until Jan 2015. In the figure below I have guessed at how the cumulative output curve might shift from Jan 2015 to Jan 2018.

Figure 2(click on chart for larger view)
My medium(8.4 Gb) scenario assumes that the average new well EUR remains at its present level of about 350 kb over 30 years until Jan 2015 and then the EUR starts to decrease. By Jan 2018 the cumulative output curve has shifted downward to the lower curve in Fig 2 (there are actually 35 of these curves between the two shown, one for each month, the chart would be a mess if they were all shown). A point of confusion is the distinction between decline rate and the rate of EUR decrease. In figure 2 the decline rate decrease for the Jan 2015 well is related to the slope of the upper curve and how it becomes less steep as one moves along the curve from left to right(steep near 0 months and flatter near 360 months). The number of months it takes to shift from the higher curve to the lower curve determines the rate of decrease in new well EUR. In a lower TRR scenario such a shift might take 6 months (a higher rate of decrease of new well EUR) and in a higher TRR scenario maybe 30 months (a lower rate of decrease).
So to create the three scenarios I arbitrarily assume the EUR decrease starts in December 2013 and goes from no decrease to its maximum rate of decrease over a 6 month period for the lowest scenario. Then I vary the maximum rate of EUR decrease so that the TRR is 6 Gb, in this case a 20.5% annual rate of decrease in new well EUR is the result. For the medium scenario the EUR decrease begins in Dec 2014 and reaches the maximum rate of new well EUR decrease of 14.5% per year in June 2016 and the high scenario the decrease in EUR begins in Dec 2016 and reaches the maximum rate of decrease of 9% per year in June 2018.

Figure 3 (click to enlarge)
Figure 3 shows how the new well EUR changes (blue curve) over time and the red curve shows how the annual rate of decrease in new well EUR (red curve right vertical axis) changes from Jan 2014 to Jan 2028. This is for the medium (F50) scenario.
Using the scenarios developed for figure 1, I will now introduce economic assumptions to determine the economically recoverable resource(ERR) for each of the low, medium and high scenarios, the ERR will always be less than or equal to the TRR. The figure below gives the real oil price in 2013$ per barrel on the right vertical axis and the real well cost, 30 year real net present value (NPV), and real profit in millions of 2013$, the oil price is based on the EIA's 2013 AEO reference case. This chart is from the medium scenario.

Fig 4-click to enlarge
The other economic assumptions are an annual discount rate of 15%, royalties and taxes are 26.5 %, operating expenses(OPEX) are $4/barrel, and transportation costs are $12/barrel where all $ are 2013$ and all calculations are in real (2013$) terms. See this post in the text after fig 3 for more information on how these figures are used. Previously other costs of $3/ barrel were included, but based on information from Rune Likvern, sales from natural gas output probably covers these "other costs" so they have been eliminated. Any of these economic assumptions will likely be incorrect and are impossible to predict over 5 years let alone 20 years, so these scenarios are very likely to be inaccurate over periods of more than 2 or three years. If any of the many guesses underlying these scenarios should prove correct then the scenarios might be accurate, that is part of the reason for including a range of scenarios. Prices, well costs, and transportation costs could all be lower or higher in the future than what I have chosen, lower transportation or well costs would tend to raise output and lower oil prices would tend to reduce output if all else remains equal.
Note the sharp bend in the profit and NPV curve in figure 4 in 2019, this is because the number of new wells added each month is reduced as profits approach zero, for the medium scenario for ERR we have:

Figure 5-click to enlarge
Note the kink in the # of wells curve where the wells added each month is reduced substantially. This reduction in the number of wells added also reduces the rate of decrease in new well EUR as shown in the following chart for the medium scenario:
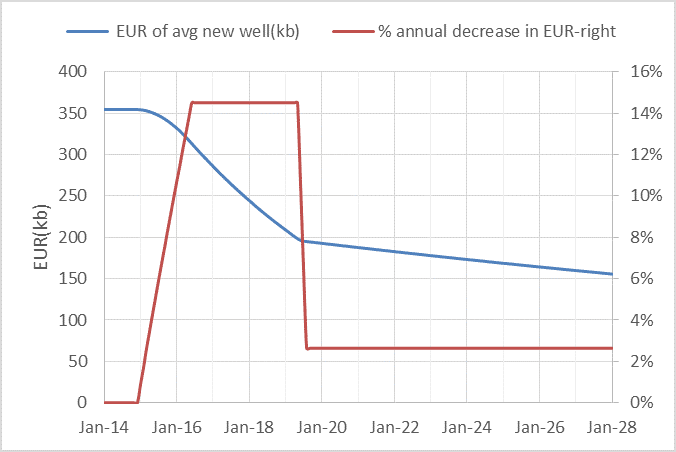
Figure 6-click to enlarge
The chart below gives the range of output for the USGS F95 to F5 estimates when the economic assumptions above are used. The range of ERR estimates is 5.1 Gb to 10.7 Gb with a best estimate of 7.4 Gb. The medium scenario peaks in 2016 to 2017 with peak output of about 1.2 MMb/d.

Figure 7-click to enlarge
It would be great to get some feedback from industry pros on the well costs, oil prices, and other economic assumptions I have used and any obvious problems with the analysis.
Dennis Coyne
Looks like a decent structure actually. the factors listed and the approach. I also get an impression that you are coming at it without driving it to a bias (cornie or doomer).
ReplyDeleteI think the price uncertainty is likely bigger than the geology uncertainty. And this will likely be driven more off of overall global supply and demand picture (e.g. if sands have the volume to keep price down, etc.)
I would actually advocate using the futures for the next 5 or 10 years (correcting for nominal to real dollars). And then just make it flat after that (or use the curvature from the 10 years to fair in a hyperbolic. This will make the world look better, but the Bakken look worse.
I can parse it more, but you have to beg me. (Since it's work and since I don't want to do it, if I'm just seen as an enemy.)
Futures
Hi Nony,
ReplyDeleteI often cross post at peak oil barrel. There is some interesting discussion over there, though maybe a bit on the doomerish side, there is a bit of balance. Could I beg you to do the kind of price forecast that you suggest? I could incorporate it to my model and you would be given credit of course for your work. I am curious about your take on the EIA's AEO reference scenario for oil prices, too low, high?
The AEO 2013 reference scenario was the basis for my prices, though I should update it to the AEO 2014 reference scenario.
I posted over there. Please don't "credit me". I am not some oil promoter (I work in pharmaceuticals). I am just a person on the Internet goofing off and chatting and such. Really prefer to keep low profile, since I'm goofing off from work. :)
ReplyDelete