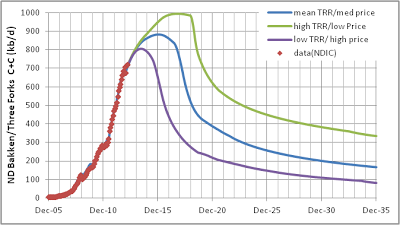
In my June 14 post I discussed future decreases in average well productivity based on a single average well profile to create scenarios which would match the range of technically recoverable resources (TRR) in a recent USGS estimate for the Bakken/ Three Forks.
A recent discussion at the June 15, 2013 Drumbeat at the Oil Drum was very interesting with Rune Likvern providing great insight (as usual) into recent data on Bakken output in North Dakota.
Mr Likvern believes that we may be seeing a decrease in average well productivity because a simulation with wells added at a rate of 125 well per month from Jan 2013 to April 2013 is showing greater output than recent data with 70 fewer wells added (500 for simulation vs 570 actual). A decrease in average well productivity is one possible explanation. An alternative possibility is that the average well profile may be different from the average well profile that Mr. Likvern has chosen.
I have created various well profiles in an attempt to match James Mason's work, Rune Likvern's work, the NDIC typical well, and the actual production data from the NDIC. I have recently created some newer well profiles by using a minimization of the sum of the squared residuals between the model and data over the period from Jan 2010 to April 2013. When no constraints are put on the minimization we get qi=11070, b=0.41, and d=0.078 (I call this model 7).
